Why Do I Need It?
With Fenorri, you can create reports in just a few minutes using simple drag-and-drop and configuration actions. Your reports can pull in information from data sources like user input forms and calculated values. You can include tables and charts in your reports, which can be shared, saved, and commented on - this even applies to individual parts of the report! For example, you can share, comment on, or like a specific chart separately. Plus, you can easily send your report via comments or messages, and it will always display the most current data. This makes Fenorri an excellent tool for creating and sharing reports within your organization, helping you monitor metrics, review stats, and support your planning activities.
Create, View, Share, Post
Using a simple drag-and-drop editor, create custom reports. No coding required! Then you can view or share the report. Everyone always sees real-time data and current report version!
Create Charts Instantly
Create charts from user specified sources. Available formats include: line, area, column, bar, donut, histogram, combo, scatter, pie, map, trend, table, tree map, organizational, gauge, candlestick.
You can also show a report during a business app. For instance, your business app is allowing the end-user to review some performance metrics to decide if a new project can be scheduled at this stage or not, and by showing the end-user current report on performance stats will allow them to make the right decision while executing the business app. You can also use reports inside your business apps purely for informative reasons, for example, to show current stats on failed sales or orders, so that the end-user is informed, is capable to make the right decision at the right time, and is receiving only the real-time data, stats and results.
Your reports can be added to your TODO list, making it easy to create a task and schedule it inside your calendar with a drag-and-drop. For instance, you might have a sales report which you need to review. With Fenorri, you can add the report to your TODO List and add the item to your calendar, for instance, on Friday morning so that you won't forget what you need to do, having the report sitting inside your calendar, allowing you to access it with one click.
BI Reports & Report Editor
Open your top menu and click on the 'Reports' item: 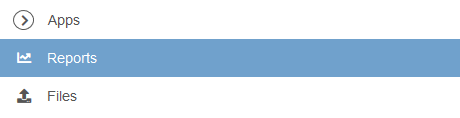
You will see a board with reports (if you have any, otherwise the board will be empty at first): 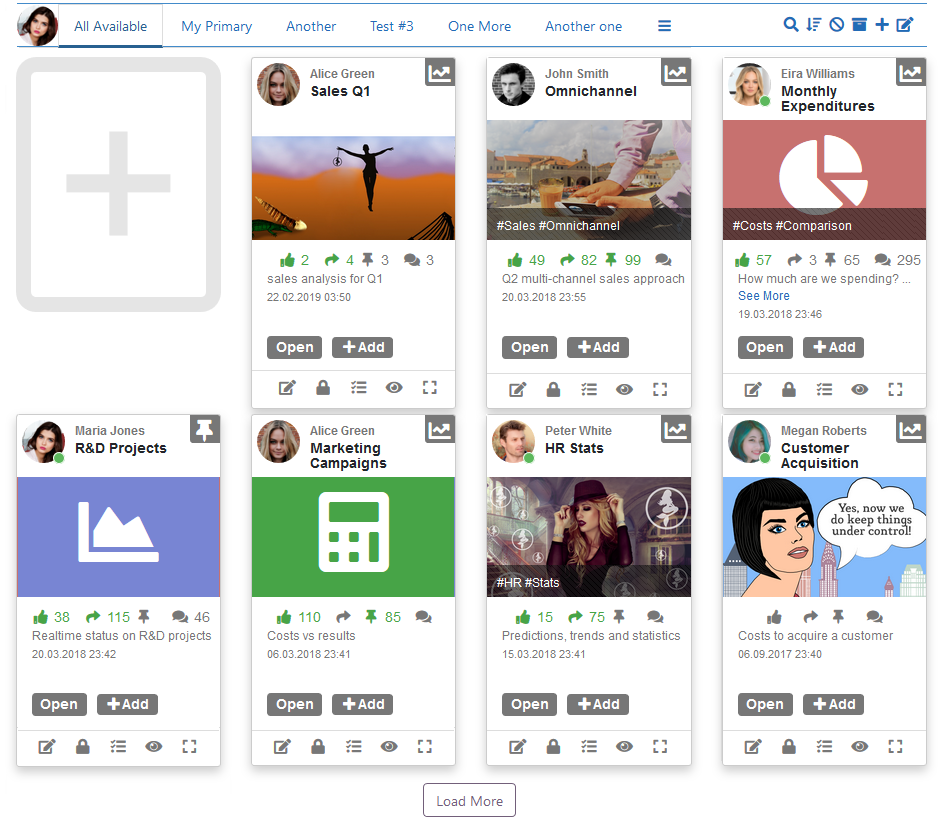
How do reports look like?
Your reports have can contain tables and charts. You can add as much of data from different sources to your table, link it via fields and filters, set sorting and other parameters. You can hide the table, and only display charts. You can have as many charts as you like. 
Automated Row Grouping
The system will automatically group and collapse rows that share the same value in the first column.
In the example above, the system has also summed the values in the last column. This occurs automatically when you set the formatting of any column to 'money.'
If you expand the group, you'll see all the rows that were collapsed.
To prevent your records from being grouped and collapsed, simply enable the following option in the Table configuration, as shown below.
Filters for BI Report View
When viewing a report, end users can apply their own filters at the table level.
The system will display a dialog where different filters can be applied.
A report column can contain one of the following types of data:
- date/time
- numeric
- text
- master data
- hard coded data
The system now supports all five data types, enabling filters to be set based on the data type. For example, if the data type is 'date,' the following options will be displayed when setting the filter:
If the data type is 'master data' or 'hard-coded data,' the following will be displayed, listing all available data options in the system, along with an option to 'load more':
If the data type is numeric (e.g., a calculated value like 'total'), the end user can specify a range with 'from' and 'to' values:
Use the following toggle control to show or hide filtered records.
Drill-Through Functionality for Table Records
When creating a report, you can include a field that contains a formula. This formula can incorporate mathematical operations such as SUM, AVG, COUNT, MIN, and MAX.
As you can see, the system automatically transforms table rows into hyperlinks for reports that use SUM, AVG, COUNT, MAX, or MIN operations, enabling users to click and view the records that produced those values in a dialog.
When drilling into data tables, the system will automatically display all available table fields, including those that are hidden.
Export to CSV/Excel/PDF
You can export table data to CSV, Excel, or PDF formats, which is helpful when you want to use your report data for other applications.
When the end user selects the menu option, the system will create the file and return it to the web browser. Additionally, the generated file will be saved to Fenorri Drive.
Please note that the system is currently set up to 'stream' CSV files. This means it won't generate the file on the server; instead, it will stream the text directly to the web browser.
The generation of PDF files for large tables is limited to approximately 2000 records, depending on your system configuration.
Change Access Permission
To allow other users to view or manage your report, you can click the 'lock' button:
You will see a dialogue where you'll be able to add or remove users, groups, departments, projects, and events. Start typing a person's name (or department/group/event/project name) and select your user.
Once you're finished, click the following button: 
You can constantly change access permission settings for your resources. Try to always keep the right level of authorization and ensure that your resources are shared with the right people within your organization. In general, you need to give 'Administrator' permission only to those users who need to manage your resources. You can share your resources with groups, add them to events or projects, or simply grant an access right to people from a specific department. In case you want everyone in your organization to have access to your resource, simply enable the following option:
This will ensure that absolutely everyone can view the resource. However, if you need your resource to appear on a group/department/event/project resource page, you need to add this group/department/event/project separately.
The system will automatically detect it and will then:
- enable clicking on the table row within the report (making it a hyperlink)
- upon clicking the table row, it will expand to show all records in the report, including hidden columns that may be used in a formula or need to be viewed by the end user.
The Report Card
Your reports are presented as cards inside the system:
This makes it easier to store, share and manage your reports.
Add a Comment
You can add comments to a report. Simply click the comments button: 
Your comments can include text and URLs. You can mention other people and add emoji. You can also attach other resources (such as other reports, business apps, files, emails, etc). Open your resource (full screen) and start typing in your comment, as shown below:
You can include your colleague's names by typing in the @ symbol and then start typing in their name (e.g. @pete), then select your colleague's name from the list. You can also attach a resource into your comment by pressing the following button 
A dialogue window will appear where you can select the type of resource you want to attach: 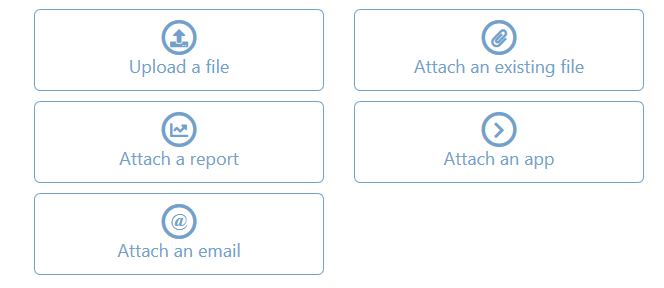
For instance, you can attach a report when answering someone's comment. Please note, you can attach only resources you have access to.
Add to TODO List
You can add a report to your TODO list by clicking on the following button:
You will be able to instantly view your new item inside your TODO list by selecting it at the top menu. In case you need to view and manage your TODO list, click the 'See all' button at the bottom of the drop-down menu.
Saved Resources
You can save a report to a board by clicking on the following button:
Then you can select your board from the list of available boards (otherwise you will need to create a board before you can save a resource).
Share
You can share your report by pressing the share button:
Then you can select where you would like to share your resources (e.g. your won timeline, a group, etc.), add a message (tag people, add a location, express an emotion, etc.), and click the share button.
Sharing Parts of a Report
You can also share a part of your report. For instance, you can share a chart or a table. Once you click the share button:
Your table/chart will appear inside a post:
Create New Boards
You can create a new board to place your resources by pressing the following button:
You can then create your new board by using the following form:
Editing Boards
You can edit your board by pressing the following button:
You will get a dialogue where you can specify your board's name and description:
Adding and Removing
You can add or remove your report to and from a report board. This means you can sort your reports inside the report boards to make it easier to store and manage them. To add or remove your report simply click the 'Add' button:
Unpublish
You can unpublish a report. This will not archive it, neither delete, but just will mark it as 'unpublished' and will remove it from the main view where only published reports are shown. This is a handy feature in case you just want to temporarily remove the report, but not archive or delete it. To do so, simply click the 'Unpublish' option from the drop-down menu.
View Not Published Reports
You can view the reports which are not published by selecting the following option from the top navigation of the page: 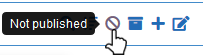
Why Do We Have Published and Archived Reports?
To ensure you don't accidentally delete a report, we've introduced this feature where you can just 'unpublish' a report, and it will hide it from various views. To delete any report forever, you need to archive it first, and only then you will be able to delete a report. This procedure is meant to make it harder to accidentally delete a report, but easy enough to follow this practice, which will potentially ensure you never lose your reports.
Archive
Just click on the drop-down menu and select 'Archive'. Your report will be archived and you can then view it at the archive section by clicking the following button: 
Delete Forever
After archiving a report, you can delete it forever. Just click on the drop-down menu and select 'Delete forever'. Your report will be deleted from the system.
View Logs
To view the activity logs for your resource, simply click on the drop-down menu and select 'View Logs':
You will see a page with all your resource's log records: You can export your logs by click the 'Export to Excel' button.
Keep an Eye
In case you would like to receive notifications on a report (e.g. someone comments the resources, it gets deleted, etc), you can click the following button and start receiving notifications automatically.
Attach Reports Inside Fenorri Messenger
Inside the messenger, open a conversation and click the 'Attach' button.
Select the 'Attach a report' option:
You will get a list of available reports, then click the button at the bottom of the card:
That's it, your report should be displayed inside the conversation:
Attach to a Post
To include a report inside your post, simply start writing a post and click on the 'Attach' button:
Select the 'Attach a report' option:
You will get a list of available reports, then click the button at the bottom of the card:
Once you finish writing your post, click the 'Post' button. Your post will be published with the report inside:
Search Reports
Click the following button and start searching: 
Sorting Reports
Click on the following button to sort either newer to older, or older to newer: 
Fenorri Report Editor
Open your top menu and click on the 'Reports' item:
To create a new report, click the following button:
To edit an existing report, click the 'Edit' button:
Regardless if you are editing an existing report or create a new one, it will open the report editor for you. This is the place where you can edit or create reports.
Data Sources, Time, Links & Filters
The only section where you can add, remove and link your data sources is located within the following panel:
You can add new data sources or formulas via drag-and-drop of one of the following:
Alternatively, you can add a new data source by clicking the following button: 
You will see a dialogue with available input forms. They are your sources, as these forms contain your business data. Select your data source:
You will be asked to select your fields. Start pressing the 'check' button at the left of your field and select as many fields as you need:
In case you need to add all of your fields, click the following button at the bottom of the dialogue screen: 
Each form contains 'hidden' fields. They have added to each of your forms automatically when you create them. These fields are used for maintenance purposes, but can be handy inside your reports:
They refer to when a record was created, who created it, when was it last modified and who has modified it. Select them if you need this type of information to appear inside your report.Click the following button once you finish: 
Your 'Data Sources, Time, Links & Filters' section will immediately be filled with the data fields which you have just selected:
Filters
To set a filter, click the field where you would like to apply a filter, e.g.:
On the right-hand side, you will see the filter menu. Click the 'plus' button to add a filter:
Depending on your field data type, you'll be able to set your filter properties, e.g.:
Click the 'Apply' button once you finish. Your data set inside your table will instantly change. In case you need to remove a filter, click the following button:
If you have more than one filter, then you can use the following setting to force all or any filters to match:
When you set it to 'Any', it will select a record if at least one filter matches. If you select 'All', then it will only include a record if all filters have matched. Your field with a filter will be marked with the following icon:
Linking Data Sources
If you have more than one data source, you might want to link them. Why would you need to do that? Consider that your data source 'A' contains customer address and your data source 'B' contains customer order information. If both data sources contained the customer number, you will need to link the two data sources via that field. Alternatively, if email addresses are unique, you can link both data sources via the email address. This is essential, otherwise, your report will not make any sense. In the following example, we have two data sources, and we've decided to link them via two fields: email address and last modified date:
To link your data sources, click the data field's 'link' icon:
Select your second field, e.g.:
Your fields should be instantly linked:
To remove your link, click on it. On the right side, you will see an option 'Delete'. Click on it and your link will be deleted.
Database Join
A database join is an operation that combines rows from two or more tables based on a related column between them, allowing for the retrieval of related data.
When you link two fields, you can also specify the type of database join you want to use.
INNER JOIN Inner Join returns only the rows that have matching values in both tables. For example, if you have a table of customers and a table of orders, an inner join will return only the customers who have placed orders.
LEFT JOIN Left Join returns all the rows from the left table and the matched rows from the right table. If there’s no match, the result is NULL for the right table’s columns. For instance, if you left join customers with orders, you’ll get all customers, including those who haven't placed any orders.
RIGHT JOIN Right Join is the opposite of a left join; it returns all the rows from the right table and the matched rows from the left table. If there’s no match, NULLs will appear in the left table’s columns. Using the previous example, a right join will show all orders, including those that do not have corresponding customer records.
CROSS JOIN Cross Join returns the Cartesian product of the two tables, meaning it pairs every row from the first table with every row from the second table. For example, if you have 3 customers and 2 orders, a cross join will return 6 combinations (3 x 2).
Each type of join serves different purposes depending on the desired data output and relationships between the tables.
If you're unsure which database join to use, simply select the 'Equals' operation.
Edit Data Section
To edit your data section, click the following 'Edit' button:
You will see on the right side the following menu:
Filter & Links Settings
You can link your filters and links by using 'All' or 'Any' option in the following section:
That means the rules you are setting for the 'All' and 'Any' setting will apply only if you have linked two or more data sources by linking their fields. The same applies to filters. In case you have filters inside your data sources fields, then the same principle will apply. 'All' will consider if any filter matches, while 'Any' will look only for the results which correspond to all of our filters. To give you an example, consider the following scenario where you have 2 data sources linked via 2 links:
Both data sources contain the 'email' field, which is linked between the two. Also, both data sources 'last modified date' is linked. If we want both links to match, then we will select the following in on the right side menu:
If we want any of the links to match (meaning either 'email' or 'last modified date'), then we need to set that option to 'Any':
Just keep in mind that this option works when you link at least 2 fields together or apply filters to more than 1 field. ANY means that any link or filter condition may match, but they are not mandatory. ALL means that all links and filter conditions must match. They are all mandatory, otherwise, there will be no results.
This option is handy in case you know exactly what records to select. For instance, you want to select only 'John Smith' records for your client report. Otherwise, this option will limit you to only viewing the records you've selected, skipping all other data.
Group results by
If you need your report data to be grouped by some field(s), then use the following section to create your 'group by' settings:
Once you select your 'group by' records, the color will change and you will see a 'minus' button instead of a 'plus' in the bottom right corner:
You can select 1 or more fields and even change their order. Depending on how you group your results, your table and diagrams will look different.
Order results by
if you need your data to be ordered inside your report, use the following option:
By clicking the 'Descending/Ascending' button you will change your result's order. You can select one or more fields and even change their order. Depending on how you order your results, your table and diagrams will look different.
Date/Time
You can set a period of your report data. This will show data only from the date/time which you will set in the following section:
You can either set your period (e.g. 'Last Week') or select your time range using 'From' and 'To' settings. At the bottom of this section, you will see a block with your data source. In case you have more than one data source, you may select which data source should this rule be applied. You can select one or more blocks. How does the system know which data field to apply this rule? Well, we have the 'lastmodified' field inside each of your data sources. This rule will be simply applied to that field.
Table
Your Table area is located under the following section
For example, the following is a table that is generated automatically for the data sources you have selected:
To remove a field from your table, click the following 'minus' button at the right bottom corner of the field:
To edit your table, click the following button:
On the right side you will see the following menu:
You can hide the table completely from your report by enabling the following option:
The following option allows to control your report table pagination:
You can set any meaningful value, but remember that by limiting it to a smaller number your report will load faster and will be easier to view.
Editing and Deleting Records
If you want to allow end users to edit or delete records in the report table, enable the option below.
This option effectively transforms your report table into an Excel-like table, giving end users full flexibility to edit or delete rows.
Additional Information
This section can include additional data that you can format freely. You can also add images, URLs, and dynamic data from your BI report.
The purpose of this section is to give you more flexibility in how you choose to represent your data.
Use the following control to insert dynamic data that will be calculated when the BI report is opened.
You can also create another table and include any values you want, whether static or dynamic.
Anything you place here will appear as a section of your BI report.
Charts
Your charts are located under the following section:
You will immediately see the following on the right side:
Selecting Data Fields
You need to select your data fields inside your chart. Make sure you first select a 'text' field and then a 'number' field. For instance, below we have selected customer name and price:
That's the way charts work. Before you start editing anything, make sure you select at least 2 fields, the first one with a text value and the second one with a numeric value. If you need to re-order fields, just start dragging your field until you get to the position you want, e.g.:
In the bottom left corner you have a button to expand the area that contains your fields:
Editing Charts
Click the 'edit' button to edit your chart: 
You will see the configuration screen where you can change your chart type and set other parameters, e.g.:
Removing Charts
Simply click the following button to remove a chart: 
Possible Issues in Charts
Charts are normally running smoothly, however, there might be some issues when creating charts:
Your second data field does not contain a numeric value
- This happens if you select data fields that do not contain any numeric values. Please make sure that your first data field is of a text type, while your second data field is numeric. Otherwise, you will see the following message
Your first data type is text, but some values are empty
- This can happen if your data is empty. The chart will display an error. To avoid this, make sure you set a filter inside your text field, indicating it must be NOT empty, e.g.:
You have selected a char type that expects 2 data fields (text and number), but instead, you have selected 3 or more data fields. You will see the following message:
- You will either need to select only 2 data fields or change your chart type by clicking the 'Edit' button and selecting the appropriate chart type.
Report Formula Fields
Your report can contain calculated via formula fields. To enable this, just drag-and-drop the following into your 'Data Sources, Time, Links & Filters' section:
You will see a dialogue with a formula editor:
To calculate anything, just drag-and-drop a data source field. You can add as many fields as you need. Mathematical operators which you can use include:
- + (to add)
- - (to subtract)
- * (to multiply)
- / (to divide)
- You can use brackets to separate your calculations ()
For instance:
You can also apply the following to any data source field:
Sum of all values for the given field 
Minimum of all values for the given field 
Maximum of all values for the given field 
Count of how many records to we have 
Average of all values for the given field 
That means that if we did the following:
We will get the maximum value for the field 'price' located in the Customer Order data source (otherwise you can also call it an 'input form'). Your formula will have its own representation at the 'data sources' section:
If you click on it, you will get the configuration panel on the right side, where you can apply some settings to your formula block. For example, you can give it a title:
You can format it:
You can even configure how many decimal places should be shown if the number has a decimal value:
If you decide to use the 'Custom money/number format', you will get the following set of options to configure:
- Your 'currency symbol or other names' can be anything, for instance: ¥
- you can select 'place at the beginning' if you need it to be placed before the number
- you can select 'place at the end' in case you want the symbol to appear at the end
- You can decide how many decimal points should it show, for instance: 2
- You can also set your 'decimal point', for instance '.'
- You can set your own 'thousands separator', for instance, you can set it to be a comma ','
- You can select the 'Roundup' option
For example, your configuration can look similar to the following:
Report Settings
Click the following button at the top of your page:
On the right side you will see the following settings:
Fill in these fields. Your report must have a title, the other fields are optional.
Publishing a Report
To make a report published (or not published), click the following button at the top of your page:
Then enable or disable the following field:
Archiving a Report
To make a report archived (or not archived), click the following button at the top of your page:
Then enable or disable the following field:
View All Apps Using This Report
Click the following button at the top of your page:
To view a list of business apps using your report, click the following button:
Tags
Your report can contain tags. This makes it easy to categorize your reports and can be later used for searching and sorting. To view tags, click the following button at the top of your page:
You will see a section that can contain report tags.
Report Cover
Your report card can contain a cover, making it easier to view your report inside various pages, e.g.:
You can set your report cover by first clicking the following button at the top of your page:
On the right side of your page, scroll down until you see the following section:
You can set an image by clicking the 'Browse' button. Alternatively, you can set an icon/character with a background color.
Change Access Permission
You can set your access configuration by clicking on the following button:
You will see a dialogue where you'll be able to add or remove users, groups, departments, projects, and events. Start typing a person's name (or department/group/event/project name) and select your user.
Once you're finished, click the following button:
You can constantly change access permission settings for your resources. Try to always keep the right level of authorization and ensure that your resources are shared with the right people within your organization. In general, you need to give 'Administrator' permission only to those users who need to manage your resources. You can share your resources with groups, add them to events or projects, or simply grant an access right to people from a specific department. In case you want everyone in your organization to have access to your resource, simply enable the following option:
This will ensure that absolutely everyone can view the resource. However, if you need your resource to appear on a group/department/event/project resource page, you need to add this group/department/event/project separately.
Save, Preview, Clear, etc.
You can clear your report, save it as a new report, create a new one or save an existing one by using the buttons located at the bottom of your screen:
For instance, the 'Quick Preview' button allows viewing your report while editing it.
Reports Inside Business Apps
Your reports can be used inside a business app. You can easily add a report inside your business app by dragging and dropping the following:
You will see the following inside your diagram:
You can set your block's name and its icon by configuring the following:
To select your report, click the following button:
You'll be able to see your reports and select the one you wish to display inside the business process:
That's it! Your report will be displayed during the business app execution. The end-users will see the report and will be able to continue with the business app after reviewing the report, e.g.:
Integrating with External Databases
You can connect to other databases. This is done at the table level, requiring each external database table to be imported individually.
After importing an external database table, it will function like a standard form, enabling you to use it within no-code applications and business intelligence tools.
To import an external database table, go to the Forms or Master Data menu at the top.
Select the menu option below to begin importing an external table:
Your conversations have their menu which contains several useful options:
An imported external database table will be displayed as a standard form in the system:
If you have write permissions for the external database table, you'll be able to edit data; otherwise, you'll only have access to view it.
Please note that all data will be stored in the external database, not locally. You will access all the data from the external database, which means any network latency could affect performance, depending on the system you’re connecting to.
Your conversations have their menu which contains several useful options:
A dialog box will appear where you’ll need to enter your password and submit the form.
Please note, some data formats are not supported, and this limitation is imposed by the database technologies, not us.
The system will automatically skip fields which have the following format: BIT, BINARY, TINYBLOB, BLOB, MEDIUMBLOB, LONGBLOB, TINYTEXT, MEDIUMTEXT, LONGTEXT, ENUM, SET, Geometry
Include Row Numbering in the Table
If your report contains a table with rows of data, you may want to add automatic row numbering. This can be done by enabling the option in the table configuration screen within your BI editor.
Once row numbering is enabled, numbers will be automatically displayed for each row when end users view the report.
Send report screenshots
This feature enables you to use the Fenorri Automated Scheduler to automatically capture screenshots of your report and send them via email to recipients at your specified time.
Open your report to begin using this feature. Next, click the button below.
This feature is only available if you have created an email connection. If you receive a message stating that you have no email connections, please click the provided link to create your email connection before using this feature.
If you have at least one email connection, you will be directed to the following configuration screen.
Complete the configuration form by providing all the required details. You can use rich text editing for your email content. If you'd like the report URL to be included in the email, make sure to enable this option by checking the box in your configuration.
Add as many users as needed in the configuration below. You can include departments, groups, and projects, and the system will automatically extract users and their email addresses. When you're done, click the button as shown below.
At the specified time, the system will generate a screenshot of the report and email it to the recipient. Everyone will receive an email with your message and the screenshot attached, as shown below.
Your settings are saved automatically, and you can view them by clicking the button below:
You will see a list of all configurations for that report, and you can edit or delete any of them.
Important!
When you open your report, you can apply filters, set search criteria, and more. If you've customized filters, search parameters, time settings, or other preferences, the system will automatically recognize and apply them, ensuring your report is generated with your chosen settings.
If you're editing an existing configuration, the original filter, search criteria, time settings, or other preferences will remain unchanged. To modify them, you'll need to delete the configuration and save a new one.
Please note that if you configure your report to be sent only once within the next 10 minutes, the configuration will be automatically deleted once the report is sent.
Insert chart from a different report
If you have charts in other reports that you'd like to include in your current report, you can easily do so.
To insert a chart from a different report, click the option below.
Select the report you wish to use.
After selecting the report, pick the chart you'd like to include.
The chart will be added to your report.
Once saved, the external chart will appear within your report.
Table Field Formatting
To format your table fields, open the table’s edit options and choose the appropriate format for each data field, as shown below.
For example, you can apply a currency, date, or time format to a field. You can also choose to display the entire column in bold by selecting the corresponding option. Based on your data type and needs, you can customize the formatting to suit your requirements.
The formats you apply in the editor will also carry over to the Excel export of your report.
Table Totals
To automatically display totals for all numeric columns in a table, open the table configuration options as shown below.
The system will then add an extra row at the bottom of the table, showing the total for each numeric column.
Counters in BI Reports
To add a counter to your BI report, click the Counter button.
This will insert a counter widget into your report, allowing you to define up to three values.
Each value requires a name and a configuration.
Enter the name in the provided text box.
Configure the value by clicking the configuration option as shown below, which opens the formula editor.
In the formula editor, you can define any type of calculation to generate the value.
You may choose to define one, two, or all three values. If you only configure one value, the system will automatically adjust the counter's layout to display just that single value in the BI report viewer.
At runtime, the system will populate and animate the counter values when the report is opened.
Knob Diagrams
If you want to visually represent KPIs or compare current values against goals, a knob diagram is a great option. It displays your current and target values, along with a percentage to indicate how close you are to reaching your goal.
To add a knob diagram to your report, click the Knob Diagram option.
Set the Diagram Name: At the top of the configuration panel, enter a name for your knob diagram.
Label Your Values: Define labels for your two values (e.g. Current and Target), though you can name them however you like.
Configure the Values: To set up the values, use the menu option shown below to open the formula editor. Here, you can define any formula needed to calculate the current and target values.
In the formula editor, you can define any type of calculation to generate the value.
At runtime, the knob diagram will appear in your BI report, displaying the values and automatically visualizing your progress toward the goal.
Dashboards
You can easily convert any BI report into a dashboard.
To do this, select the top editing option and set the report type to Dashboard as shown below.
If you want to include additional reports within your dashboard, click the Add Report button. This lets you combine multiple reports into a single view.
Single Report: If your dashboard contains only one report, the end user will see just that report when they open it.
Multiple Reports: If you add more reports, they will be displayed one after the other on the same page.
This setup allows you to aggregate multiple reports into one dashboard while preserving each report’s full functionality — including filters, sorting, search, and more. Each report remains independent and fully interactive.
Once a report is converted into a dashboard, any user with access to the report will also see it listed under their Dashboards.
To view all dashboards, simply go to the Dashboards menu, as shown below. All available dashboards will be listed in one place for easy access.
Was this article helpful?